


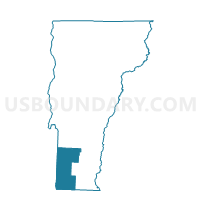
Census Tract 9703, Bennington County, Vermont
About
Outline

Summary
| Unique Area Identifier | 499229 |
| Name | Census Tract 9703 |
| County | Bennington County |
| State | Vermont |
| Area (square miles) | 86.81 |
| Land Area (square miles) | 86.70 |
| Water Area (square miles) | 0.10 |
| % of Land Area | 99.88 |
| % of Water Area | 0.12 |
| Latitude of the Internal Point | 43.22481970 |
| Longtitude of the Internal Point | -73.19896650 |
| Total Population | 1,119 |
| Total Housing Units | 769 |
| Total Households | 471 |
| Median Age | 47.6 |
Maps

Graphs
Select a template below for downloading or customizing gragh for Census Tract 9703, Bennington County, Vermont


Neighbors
Neighoring Census Tract (by Name) Neighboring Census Tract on the Map
- Census Tract 860, Washington County, NY
- Census Tract 900, Washington County, NY
- Census Tract 9642, Rutland County, VT
- Census Tract 9643, Rutland County, VT
- Census Tract 9702, Bennington County, VT
- Census Tract 9704, Bennington County, VT
- Census Tract 9706, Bennington County, VT
- Census Tract 9707, Bennington County, VT
Top 10 Neighboring County Subdivision (by Population) Neighboring County Subdivision on the Map
- Manchester town, Bennington County, VT (4,391)
- Salem town, Washington County, NY (2,715)
- Arlington town, Bennington County, VT (2,317)
- Dorset town, Bennington County, VT (2,031)
- Hebron town, Washington County, NY (1,853)
- Pawlet town, Rutland County, VT (1,477)
- Danby town, Rutland County, VT (1,311)
- Sunderland town, Bennington County, VT (956)
- Rupert town, Bennington County, VT (714)
- Sandgate town, Bennington County, VT (405)
Top 10 Neighboring Elementary School District (by Population) Neighboring Elementary School District on the Map
- Manchester School District, VT (4,391)
- Mettawee Community Union School District 47, VT (2,191)
- Dorset School District, VT (2,031)
- Currier Memorial Union School District 23, VT (1,566)
- Sunderland School District, VT (956)
Top 10 Neighboring Secondary School District (by Population) Neighboring Secondary School District on the Map
- Pawlet School District, VT (1,477)
- Danby School District, VT (1,311)
- Rupert School District, VT (714)
Top 10 Neighboring Unified School District (by Population) Neighboring Unified School District on the Map
- Granville Central School District, NY (7,638)
- Cambridge Central School District, NY (6,547)
- Salem Central School District, NY (4,034)
- Arlington School District, VT (2,317)
- Sandgate School District, VT (405)
Top 10 Neighboring State Legislative District Lower Chamber (by Population) Neighboring State Legislative District Lower Chamber on the Map
- Assembly District 112, NY (139,495)
- Bennington-4 State House District, VT (4,391)
- Bennington-Rutland-1 State House District, VT (4,130)
- Rutland-8 State House District, VT (3,988)
- Bennington-5 State House District, VT (3,776)
Top 10 Neighboring State Legislative District Upper Chamber (by Population) Neighboring State Legislative District Upper Chamber on the Map
- State Senate District 45, NY (306,856)
- Rutland State Senate District, VT (57,676)
- Bennington State Senate District, VT (39,001)
Top 10 Neighboring 111th Congressional District (by Population) Neighboring 111th Congressional District on the Map
Top 10 Neighboring 5-Digit ZIP Code Tabulation Area (by Population) Neighboring 5-Digit ZIP Code Tabulation Area on the Map
- 12832, NY (7,106)
- 05255, VT (4,121)
- 12865, NY (3,663)
- 05250, VT (3,408)
- 05739, VT (1,407)
- 05251, VT (1,350)
- 05761, VT (1,000)
- 12873, NY (736)
- 05776, VT (714)
- 05775, VT (623)
Data
Demographic, Population, Households, and Housing Units
** Data sources from census 2010 **
Show Data on Map
Download Full List as CSV
Download Quick Sheet as CSV
| Subject | This Area | Bennington County | Vermont | National |
|---|---|---|---|---|
| POPULATION | ||||
| Total Population Map | 1,119 | 37,125 | 625,741 | 308,745,538 |
| POPULATION, HISPANIC OR LATINO ORIGIN | ||||
| Not Hispanic or Latino Map | 1,098 | 36,600 | 616,533 | 258,267,944 |
| Hispanic or Latino Map | 21 | 525 | 9,208 | 50,477,594 |
| POPULATION, RACE | ||||
| White alone Map | 1,073 | 35,858 | 596,292 | 223,553,265 |
| Black or African American alone Map | 5 | 308 | 6,277 | 38,929,319 |
| American Indian and Alaska Native alone Map | 3 | 94 | 2,207 | 2,932,248 |
| Asian alone Map | 12 | 269 | 7,947 | 14,674,252 |
| Native Hawaiian and Other Pacific Islander alone Map | 0 | 16 | 160 | 540,013 |
| Some Other Race alone Map | 6 | 113 | 2,105 | 19,107,368 |
| Two or More Races Map | 20 | 467 | 10,753 | 9,009,073 |
| POPULATION, SEX | ||||
| Male Map | 570 | 17,954 | 308,206 | 151,781,326 |
| Female Map | 549 | 19,171 | 317,535 | 156,964,212 |
| POPULATION, AGE (18 YEARS) | ||||
| 18 years and over Map | 905 | 29,522 | 496,508 | 234,564,071 |
| Under 18 years | 214 | 7,603 | 129,233 | 74,181,467 |
| POPULATION, AGE | ||||
| Under 5 years | 50 | 1,877 | 31,952 | 20,201,362 |
| 5 to 9 years | 47 | 1,990 | 34,654 | 20,348,657 |
| 10 to 14 years | 60 | 2,147 | 37,637 | 20,677,194 |
| 15 to 17 years | 57 | 1,589 | 24,990 | 12,954,254 |
| 18 and 19 years | 24 | 1,089 | 21,022 | 9,086,089 |
| 20 years | 10 | 530 | 10,433 | 4,519,129 |
| 21 years | 7 | 465 | 9,651 | 4,354,294 |
| 22 to 24 years | 24 | 1,138 | 23,767 | 12,712,576 |
| 25 to 29 years | 47 | 1,751 | 35,441 | 21,101,849 |
| 30 to 34 years | 38 | 1,641 | 34,181 | 19,962,099 |
| 35 to 39 years | 56 | 1,872 | 36,358 | 20,179,642 |
| 40 to 44 years | 89 | 2,410 | 42,001 | 20,890,964 |
| 45 to 49 years | 101 | 2,942 | 50,110 | 22,708,591 |
| 50 to 54 years | 78 | 3,099 | 52,493 | 22,298,125 |
| 55 to 59 years | 89 | 2,922 | 48,739 | 19,664,805 |
| 60 and 61 years | 30 | 1,124 | 17,634 | 7,113,727 |
| 62 to 64 years | 62 | 1,544 | 23,600 | 9,704,197 |
| 65 and 66 years | 32 | 885 | 12,819 | 5,319,902 |
| 67 to 69 years | 42 | 1,180 | 16,571 | 7,115,361 |
| 70 to 74 years | 71 | 1,497 | 20,148 | 9,278,166 |
| 75 to 79 years | 39 | 1,293 | 15,960 | 7,317,795 |
| 80 to 84 years | 41 | 1,075 | 12,783 | 5,743,327 |
| 85 years and over | 25 | 1,065 | 12,797 | 5,493,433 |
| MEDIAN AGE BY SEX | ||||
| Both sexes Map | 47.60 | 45.10 | 41.50 | 37.20 |
| Male Map | 47.50 | 44.00 | 40.40 | 35.80 |
| Female Map | 47.70 | 46.10 | 42.70 | 38.50 |
| HOUSEHOLDS | ||||
| Total Households Map | 471 | 15,470 | 256,442 | 116,716,292 |
| HOUSEHOLDS, HOUSEHOLD TYPE | ||||
| Family households: Map | 327 | 9,767 | 160,360 | 77,538,296 |
| Husband-wife family Map | 280 | 7,447 | 124,395 | 56,510,377 |
| Other family: Map | 47 | 2,320 | 35,965 | 21,027,919 |
| Male householder, no wife present Map | 17 | 685 | 11,326 | 5,777,570 |
| Female householder, no husband present Map | 30 | 1,635 | 24,639 | 15,250,349 |
| Nonfamily households: Map | 144 | 5,703 | 96,082 | 39,177,996 |
| Householder living alone Map | 113 | 4,624 | 72,233 | 31,204,909 |
| Householder not living alone Map | 31 | 1,079 | 23,849 | 7,973,087 |
| HOUSEHOLDS, HISPANIC OR LATINO ORIGIN OF HOUSEHOLDER | ||||
| Not Hispanic or Latino householder: Map | 467 | 15,317 | 253,871 | 103,254,926 |
| Hispanic or Latino householder: Map | 4 | 153 | 2,571 | 13,461,366 |
| HOUSEHOLDS, RACE OF HOUSEHOLDER | ||||
| Householder who is White alone | 461 | 15,124 | 248,163 | 89,754,352 |
| Householder who is Black or African American alone | 1 | 84 | 1,594 | 14,129,983 |
| Householder who is American Indian and Alaska Native alone | 1 | 35 | 912 | 939,707 |
| Householder who is Asian alone | 1 | 72 | 2,077 | 4,632,164 |
| Householder who is Native Hawaiian and Other Pacific Islander alone | 0 | 3 | 48 | 143,932 |
| Householder who is Some Other Race alone | 2 | 33 | 554 | 4,916,427 |
| Householder who is Two or More Races | 5 | 119 | 3,094 | 2,199,727 |
| HOUSEHOLDS, HOUSEHOLD TYPE BY HOUSEHOLD SIZE | ||||
| Family households: Map | 327 | 9,767 | 160,360 | 77,538,296 |
| 2-person household Map | 182 | 4,873 | 77,346 | 31,882,616 |
| 3-person household Map | 65 | 2,198 | 36,988 | 17,765,829 |
| 4-person household Map | 55 | 1,684 | 30,093 | 15,214,075 |
| 5-person household Map | 15 | 690 | 10,783 | 7,411,997 |
| 6-person household Map | 7 | 195 | 3,381 | 3,026,278 |
| 7-or-more-person household Map | 3 | 127 | 1,769 | 2,237,501 |
| Nonfamily households: Map | 144 | 5,703 | 96,082 | 39,177,996 |
| 1-person household Map | 113 | 4,624 | 72,233 | 31,204,909 |
| 2-person household Map | 26 | 956 | 19,543 | 6,360,012 |
| 3-person household Map | 4 | 79 | 2,707 | 992,156 |
| 4-person household Map | 1 | 35 | 1,117 | 411,171 |
| 5-person household Map | 0 | 4 | 324 | 126,634 |
| 6-person household Map | 0 | 1 | 99 | 48,421 |
| 7-or-more-person household Map | 0 | 4 | 59 | 34,693 |
| HOUSING UNITS | ||||
| Total Housing Units Map | 769 | 20,922 | 322,539 | 131,704,730 |
| HOUSING UNITS, OCCUPANCY STATUS | ||||
| Occupied Map | 471 | 15,470 | 256,442 | 116,716,292 |
| Vacant Map | 298 | 5,452 | 66,097 | 14,988,438 |
| HOUSING UNITS, OCCUPIED, TENURE | ||||
| Owned with a mortgage or a loan Map | 212 | 7,082 | 123,593 | 52,979,430 |
| Owned free and clear Map | 179 | 3,935 | 57,814 | 23,006,644 |
| Renter occupied Map | 80 | 4,453 | 75,035 | 40,730,218 |
| HOUSING UNITS, VACANT, VACANCY STATUS | ||||
| For rent Map | 5 | 378 | 5,635 | 4,137,567 |
| Rented, not occupied Map | 2 | 33 | 597 | 206,825 |
| For sale only Map | 8 | 259 | 3,598 | 1,896,796 |
| Sold, not occupied Map | 1 | 32 | 615 | 421,032 |
| For seasonal, recreational, or occasional use Map | 256 | 4,294 | 50,198 | 4,649,298 |
| For migrant workers Map | 0 | 5 | 39 | 24,161 |
| Other vacant Map | 26 | 451 | 5,415 | 3,652,759 |
| HOUSING UNITS, OCCUPIED, AVERAGE HOUSEHOLD SIZE BY TENURE | ||||
| Total: Map | 2.34 | 2.30 | 2.34 | 2.58 |
| Owner occupied Map | 2.36 | 2.40 | 2.45 | 2.65 |
| Renter occupied Map | 2.24 | 2.06 | 2.08 | 2.44 |
| HOUSING UNITS, OCCUPIED, TENURE BY RACE OF HOUSEHOLDER | ||||
| Owner occupied: Map | 391 | 11,017 | 181,407 | 75,986,074 |
| Householder who is White alone Map | 384 | 10,847 | 177,587 | 63,446,275 |
| Householder who is Black or African American alone Map | 1 | 30 | 455 | 6,261,464 |
| Householder who is American Indian and Alaska Native alone Map | 1 | 13 | 477 | 509,588 |
| Householder who is Asian alone Map | 1 | 42 | 1,070 | 2,688,861 |
| Householder who is Native Hawaiian and Other Pacific Islander alone Map | 0 | 3 | 21 | 61,911 |
| Householder who is Some Other Race alone Map | 0 | 10 | 206 | 1,975,817 |
| Householder who is Two or More Races Map | 4 | 72 | 1,591 | 1,042,158 |
| Renter occupied: Map | 80 | 4,453 | 75,035 | 40,730,218 |
| Householder who is White alone Map | 77 | 4,277 | 70,576 | 26,308,077 |
| Householder who is Black or African American alone Map | 0 | 54 | 1,139 | 7,868,519 |
| Householder who is American Indian and Alaska Native alone Map | 0 | 22 | 435 | 430,119 |
| Householder who is Asian alone Map | 0 | 30 | 1,007 | 1,943,303 |
| Householder who is Native Hawaiian and Other Pacific Islander alone Map | 0 | 0 | 27 | 82,021 |
| Householder who is Some Other Race alone Map | 2 | 23 | 348 | 2,940,610 |
| Householder who is Two or More Races Map | 1 | 47 | 1,503 | 1,157,569 |
| HOUSING UNITS, OCCUPIED, TENURE BY HISPANIC OR LATINO ORIGIN OF HOUSEHOLDER | ||||
| Owner occupied: Map | 391 | 11,017 | 181,407 | 75,986,074 |
| Not Hispanic or Latino householder Map | 390 | 10,933 | 180,120 | 69,617,625 |
| Hispanic or Latino householder Map | 1 | 84 | 1,287 | 6,368,449 |
| Renter occupied: Map | 80 | 4,453 | 75,035 | 40,730,218 |
| Not Hispanic or Latino householder Map | 77 | 4,384 | 73,751 | 33,637,301 |
| Hispanic or Latino householder Map | 3 | 69 | 1,284 | 7,092,917 |
| HOUSING UNITS, OCCUPIED, TENURE BY HOUSEHOLD SIZE | ||||
| Owner occupied: Map | 391 | 11,017 | 181,407 | 75,986,074 |
| 1-person household Map | 80 | 2,576 | 39,950 | 16,453,569 |
| 2-person household Map | 190 | 4,667 | 75,142 | 27,618,605 |
| 3-person household Map | 56 | 1,698 | 29,326 | 12,517,563 |
| 4-person household Map | 46 | 1,322 | 24,668 | 10,998,793 |
| 5-person household Map | 10 | 523 | 8,425 | 5,057,765 |
| 6-person household Map | 6 | 130 | 2,562 | 1,965,796 |
| 7-or-more-person household Map | 3 | 101 | 1,334 | 1,373,983 |
| Renter occupied: Map | 80 | 4,453 | 75,035 | 40,730,218 |
| 1-person household Map | 33 | 2,048 | 32,283 | 14,751,340 |
| 2-person household Map | 18 | 1,162 | 21,747 | 10,624,023 |
| 3-person household Map | 13 | 579 | 10,369 | 6,240,422 |
| 4-person household Map | 10 | 397 | 6,542 | 4,626,453 |
| 5-person household Map | 5 | 171 | 2,682 | 2,480,866 |
| 6-person household Map | 1 | 66 | 918 | 1,108,903 |
| 7-or-more-person household Map | 0 | 30 | 494 | 898,211 |
Loading...